

 CommSec
12 November 2018
CommSec
12 November 2018
This article was written with contribution from Alex Ralevski, International & Derivative Markets Dealer, CommSec
Charts are one of many tools available for investors to use when they’re researching shares. If you have an idea of what stock you’d like to buy, you might use stock charts to help you decide how much you’re willing to pay for a share, or when you think is the right time to buy or sell.
A stock chart is a visual representation of a stock’s historical share price movements. It can tell us things like:
The Japanese are generally credited as the inventors of the “candlestick” chart, which is widely used by traders today.[i] Back in the 18th century, a Japanese rice trader named Homma realised that the price of rice was influenced not just by supply and demand, but also by the emotions of buyers and sellers. He created candlestick charts to track both the daily prices of rice and traders’ emotions. The chart resembles a series of candlesticks, where emotions are represented by using different colours to show whether daily rice prices closed below or above their opening values.
During the 20th century, the western world began using charts as a way to visualise large amounts of stock information and identify price trends. Candlestick charts were widely adopted by traders, and today you’ll find them on most trading platforms – along with line charts, bar charts, and more.
Today, many investors use charts to gain a better overall picture of the performance of a stock. Professional traders look out for patterns that could identify short-term trends in the direction of a share price. As an investor, charts can help you identify trends like whether a stock is appreciating or depreciating in value over time; whether investors are buying up or selling out.
Charts can help you assess an opportunity or decide how to react when the behaviour of a stock changes.
A price chart can be a reflection of what’s going on in a company, and it might tell you things that the company isn’t keen to broadcast. For example, if a company announces positive financial results but their share price has consistently fallen over time, this should be your cue to do some research to find out what’s really going on.
Charts can tell you how much demand there is for a stock, and how much potential momentum it must sustain for its price to continue rising of falling. If a chart tells you that a stock is trading at unusually high volumes, this could indicate that the company has made a significant announcement and/or the price is about to go up or down. Unusual demand for a stock isn’t likely to last very long, so trading volume might be a factor in your decision to either pull the trigger or sit back and wait for things to stabilise.
Some charts help an investor spot trends or determine potential turning points for the share price of a stock. You might notice that a stock price fluctuates within a certain range, and you may be able to locate points of support (at the bottom) or resistance (at the top). This can be useful if you have a theory or a strategy about the right time to trade, and you’re looking for information to confirm whether your thinking is correct.
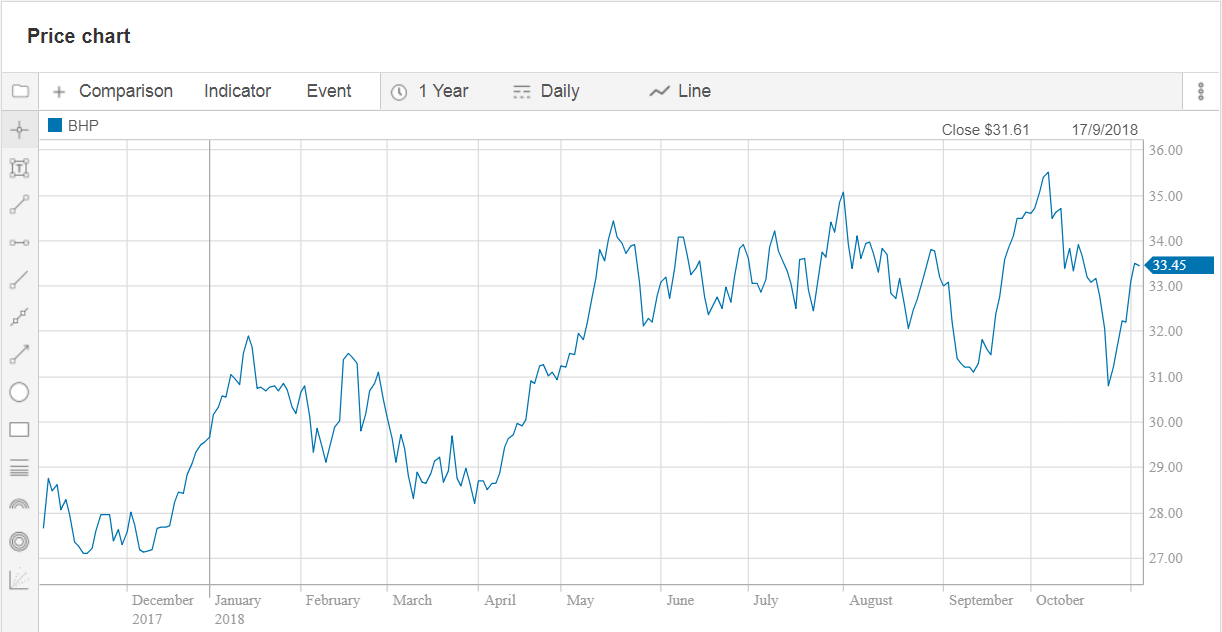
A line chart has a single line running from left to right, connecting the closing price at specified time intervals. It shows the general trajectory of a stock; whether it’s moving up or down in price.
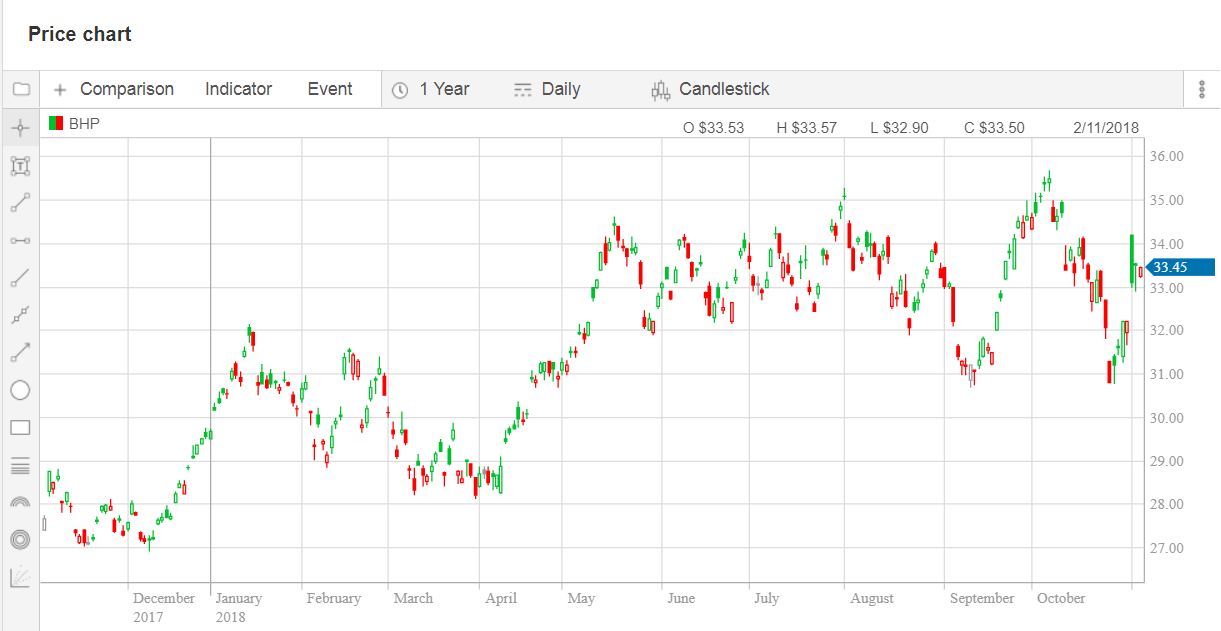
A candlestick chart shows four price points for each time period being displayed (e.g. daily or weekly).The four price points are: the opening price, high price, low price, and closing price. Each candlestick is coloured red or green, indicating whether the stock closed above or below its opening price. Candlestick charts show the direction of the price and the daily performance of the stock, and traders can use this data to assess buying or selling pressure.
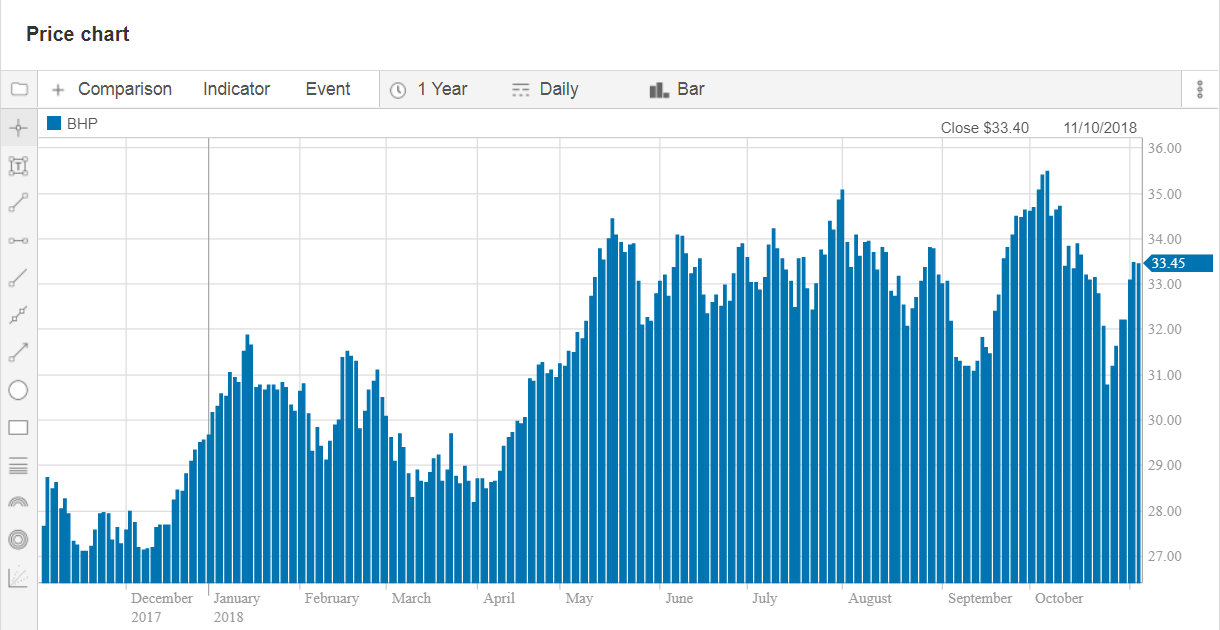
A bar chart is very similar to a candlestick chart. It displays the same four price points, however bar charts don’t have red or green colour indicators (which some people may find distracting). Each bar is plotted on the chart to display the direction of the stock’s price and the trajectory of its movement.
The investment process can be a psychological rollercoaster. Before you outlay your hard-earned capital, you want to make sure you’re as comfortable as possible with your decision. Using a combination of fundamental and technical analysis can help you get that comfort, and it might even increase the probability of a positive outcome. So explore a wide range of information, like company reports, industry analysis, and recommendations – and use charts to bolster your research.
If you have a CommSec account, you can access charting tools on our website. Log in and go to Quotes & Research, then select "Quotes" and then "Charts".
[i] https://en.wikipedia.org/wiki/Candlestick_chart
 CommSec
18 April 2018
People often use the words “investing” and “trading” to mean the same thing, but when you get down to the nitty gritty, you’ll find that investing and trading are two distinct disciplines.
Read more
 CommSec
20 August 2018
Trying to choose a company to invest in can be overwhelming, especially when you’re new to shares. Here are seven tips on where you can start your research.
Read more
 CommSec
3 August 2018
Sticking to an investment plan is the key to success for many investors. We look at why planning is so important, and how to write an investment plan that works for you.
Start trading today with Australia's leading online broker
Important Information
This information is directed and available to and for the benefit of Australian residents only and is not a recommendation or forecast.
This article is intended to provide general information of an educational nature only. It does not have regard to the financial situation or needs of any reader and must not be relied upon as financial product advice. Investors should consult a range of resources, and if necessary, seek professional advice, before making investment decisions in regard to their objectives, financial and taxation situations and needs because these have not been taken into account. Any securities or prices used in the examples given are for illustrative purposes only and should not be considered as a recommendation to buy, sell or hold. Past performance is not indicative of future performance. Commonwealth Securities Limited ABN 60 067 254 399 AFSL 238814 (CommSec) is a wholly owned, but non-guaranteed subsidiary of the Commonwealth Bank of Australia ABN 48 123 123 124 AFSL 234945 ("the Bank") and both entities are incorporated in Australia with limited liability.